pacman::p_load(ggiraph, tidyverse)In-class Ex3: Interactive Data Visualization
Installing and loading R packages
Importing data
exam_data <- read.csv("data/Exam_data.csv")ggplot(data=exam_data,
aes(x = MATHS)) +
geom_dotplot(dotsize = 0.5)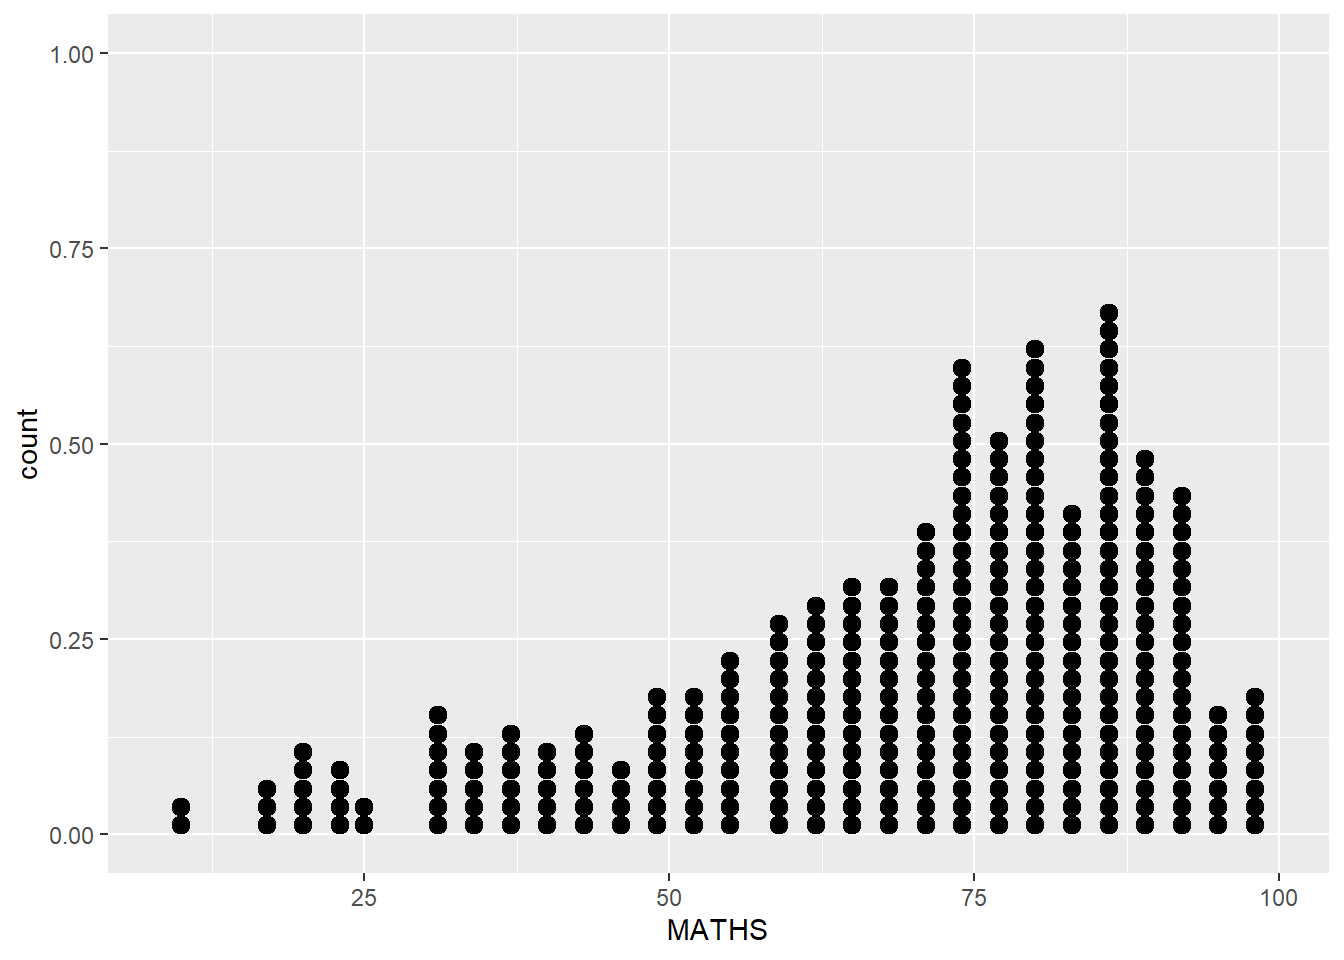
p <- ggplot(data=exam_data,
       aes(x = MATHS)) +
  geom_dotplot_interactive(
    aes(tooltip = ID),
    stackgroups = TRUE,
    binwidth = 1,
    method = "histodot") +
  scale_y_continuous(NULL,
                     breaks = NULL)
girafe(
  ggobj = p,
  width_svg = 6,
  height_svg = 6*0.618
)